Milliman’s UK Health Cost Guidelines™ (HCGs) are a tool for modelling health costs and utilisation from a payer perspective to provide a consistent way to price and analyse claims experience. The 2016 Milliman UK HCGs cover a significant proportion of the private medical insurance (PMI) market, comprising base tables for each sector of the market: corporate, small and medium enterprises 1 (SMEs), and the individual market. Further analytics include looking at cancer trends and cancerspecific costs by service lines.
This article provides an introduction to the HCGs, and insight into our findings, focusing primarily on the cancerrelated research and future projections in cancer trends.
Overview of the HCGs
The HCGs provide utilisation and average cost information by detailed service line categories, claims probability distributions for specific lines of services, and rating factors used to standardise contributor data.
The HCGs set out a flexible and consistent basis and methodology for the determination of healthcare costs for a wide variety of health insurance plans. They can be used to anticipate future healthcare costs, evaluate past experience, and establish interrelationships between the uses of various services, as well as model the effect of different claims management strategies on overall claims costs.
Cancer claims research
In this latest HCGs update we have examined cancerrelated claims in two different ways, using a variety of proprietary tools. Firstly, we looked at trends in claims directly attributable to cancer.2 This covered all claims within the hospital, community, and primary care services. The aim of this analysis was to observe the proportion of total claims that were cancer-specific and the trend in utilisation and average costs of these claims.
Secondly, we developed an algorithm based on patient and clinical condition information, derived from our Chronic Condition Hierarchical Group3 (CCHG) tool, to examine all claims related to members with cancer. By marking cancer claims and then identifying all members with cancer claims,we reviewed all claims by the ‘cancer member’ over a 12-month period, following the last cancer claim by that member.
PMPM costs by cancer claims, non-cancer claims by 'cancer member,' and all other claims
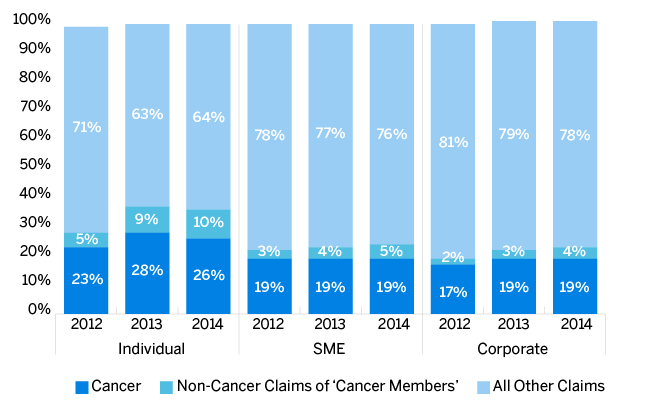
We reviewed the per member per month (PMPM) costs for each market sector by cancer claims, non-cancer claims of ‘cancer members,’ and all other claims. The graph in Figure 1 shows an averaged proportion of the total PMPM cost experienced over the majority of contributor data.
Figure 1: PMPM distribution among cancer claims, 'cancer members,' and all other members

Cancer is clearly an important contributor to claims cost per member. This is especially true within the individual market, where cancer claims and non-cancer claims by ‘cancer members’ contributed to over 35% of the cost per member in 2014. We observe lower proportions of cancer claims within the SME and corporate markets, 24% and 23% respectively.
There is an increasing trend in the proportion of cancer claims and non-cancer claims of ‘cancer members’ over the three years. With further years of analysis a firmer trend can be confirmed. This analysis has shown cancer claims are growing and they account for a significant proportion of total claims in all markets, most prominently in the individual market.
Average cost of cancer claims vs. average cost of all claims
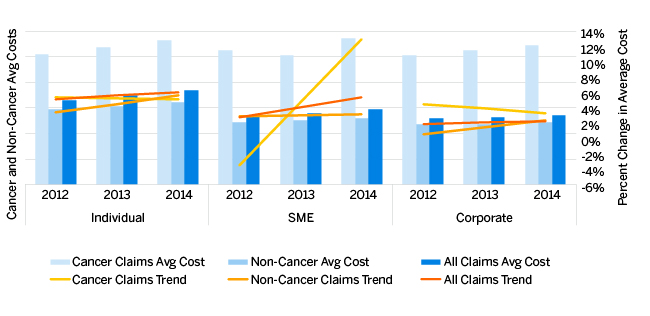
Cancer claims alone are on average nearly 50% more expensive than all claims in aggregate. The graph in Figure 2 shows the trend of cancer claims from 2012 to 2014, non-cancer claims (i.e., all claims excluding cancer claims), and aggregate claims including cancer.
Cancer claims average costs are steadily increasing over each year, regardless of market sector. Average costs of all claims and non-cancer claims are noticeably higher for the individual market. This is likely due to the different mix of claims experienced in the individual market.
Though average costs can be seen to increase over the years, the percentage change in average costs is more volatile. In general, there is a higher trend in average costs of cancer claims, though this looks to be levelling off. To derive more concrete conclusions, further years of data are required.
Our analysis also shows that the exposure in all markets to members with cancer claims is increasing sharply in general. Corporate and SME markets show a 19% to 24% increase in cancer-claiming members over 2013 to 2014, respectively. The individual market experienced a 35% increase from 2012 to 2013, which was then level in 2014. This is in contrast to a falling trend in the total exposure (number of members) in all markets. In summary, there is a clear rise in the number and proportion of members making cancer claims.
HCGs analysis and methodology
Health Cost Guidelines are presented in the form of Basic Tables (BTs), where each BT is a baseline for the market it represents. The 2016 update saw three BTs created, one for each of the following markets: corporate, SME, and individual. Inclusion of the market split more accurately reflects the different claims patterns and costs within each market.
Claims are processed to pool together all experience from various data contributors, standardising the data provided for an aggregated view. Each individual contributor’s data is risk-adjusted for a number of key factors, depending on the market, including age, gender, underwriting, duration, and purchasing power. Risk adjustment factors were calculated using general linear modelling in the 2014 HCGs update.
Cancer claims analysis used the aggregated data set of all contributors, before any risk adjustment. To identify cancer claims, ICD-9 codes relating to cancer were identified and marked, alongside the use of claims descriptions for community and primary care service claims that did not have ICD-9 codes attached.
We experienced some limitation in our analysis, which was due to coding inconsistencies among contributors and the lack of use of detailed ICD-9 codes. For example, the use of ‘internal’ company-specific codes for multiple procedures were inevitably excluded from the cancer analysis.
Our analysis has shown that cancer is certainly one of the leading causes of claims under private medical insurance across all markets and has a significant impact on an insurer’s claims experience. However, inconsistent coding and lack of granularity of coding, both among contributors and for contributors over time, are the most limiting factors in carrying out detailed analyses on trends, in both member treatment and identifying provider use of appropriate treatment pathways for effective claims management. The industry needs to make a priority of investing in strategies to improve claims data quality, as low-quality data will be a significant inhibitor to the use of more advanced analytical and big data techniques.
Cancer cost trends in the future
The advent of targeted cancer therapies (TCTs) is a potential opportunity and cost for the PMI industry. While many TCTs are likely to be expensive, there is a possibility that much more targeted treatment aimed at specific cancer types could improve outcomes and reduce unnecessary treatments and hence cost. However, it is unclear which of the many different TCTs currently under development are likely to prove effective and come to market in the next three to five years. Even more uncertain is the breadth of the patient population that will be affected and the per patient cost. Big data methods can help to identify which TCTs are most likely to be approved for use, but providing some guide on the quantitative impact typically requires a more granular data set than currently available to the PMI industry.
Figure 2: Trends in average cost of claims for cancer claims, non-cancer claims, and all claims

Considering rapid advances in medical technologies, we can see cancer as being detected more often in its early stages. Examples of such emerging techniques are cancer detection methods based on blood samples, also known as ‘liquid biopsies.’ The availability and use of new methodologies could have a positive effect on the claims costs. The offset will likely be an increase in the incidence of cancer claims; however, earlier detection could possibly mean lower average cancer costs as the cost burden of treating invasive cancers at a later stage is likely to be higher.
The implications of these new technologies on PMI pricing are dependent not only on the availability of these new techniques but also on how well the take-up emerges in the private sector, where new research is generally adopted faster. Even if the diagnostic approach does not undergo dramatic change immediately, it is possible that different levels of cancer incidence rates will emerge in the future. Our HCGs research has validated an increasing trend in the members claiming for cancer.
Applying in-depth expertise to assess the progress in cancer diagnostics and therapies and estimating the cost impact will allow insurers to keep ahead of likely successful therapies and continue to offer a comprehensive range of benefits to those most in need, whilst best managing costs.
1The SME market includes group business where total employee number was at a maximum of 50. Larger groups are included in the corporate market.
2Claims related to cancer are identified based on diagnosis codes and claims descriptions code within data.
3CCHGs are a tool used to allocate members into mutually exclusive categories according to a hierarchy which identifies their primary clinical conditions. It then groups costs according to population subgroups, rather than disease categories, and allows cost models which represent groups of patients rather than groups of claims, using either ICD-9 or ICD-10 codes.