Mortality is one of the key assumptions underlying the calculation of liabilities for pension and other postretirement benefit plans, and it is usually thought of as a long-term risk. In ordinary times, mortality is incrementally adjusted according to new data and observed trends. However, the COVID-19 pandemic has caused a sudden increase in mortality, with evidence suggesting the pandemic may have exacerbated some mortality trends and reversed others. With this in mind, how might mortality assumptions for corporate defined benefit (DB) plans be affected? This paper explores some potential effects of the pandemic on mortality trends and discusses considerations for accounting disclosures, funding valuations, and de-risking activities.
COVID-19's varying mortality impact
The COVID-19 pandemic has had a significant impact on current mortality rates. Over the period from March 22, 2020, to December 26, 2020, total deaths were 21.1% higher than expected over all ages in the United States. Of that increase, approximately 80% (16.8% over expected) is currently attributed to COVID-19.1 COVID-19 was the main contributor of excess deaths for those ages 55 and older, while other factors were predominately the cause of excess deaths for individuals younger than 55. A similar result was observed for both males and females, with males slightly more likely to have died from COVID-19 than females. These findings are broadly consistent with those in other Western countries. In one study, life expectancy at birth declined from 2019 to 2020 in 27 of the 29 countries studied, reversing the trend of increased life expectancy over the five-year period prior to the pandemic.2 Many countries in the study experienced a significant decline of more than one year, with the United States being among those most adversely affected.
Pre-pandemic mortality differences
Differential mortality has been observed for some time across different socioeconomic groups, which are based on criteria such as education, income, and employment type. One county-level study of mortality improvement in the United States, spanning almost 40 years, has shown a significant and widening gap between the highest and lowest socioeconomic groups in terms of life expectancy from age 65, moving from a difference of less than one year at the beginning of the study to a difference of approximately three years by the end.3 Further, this difference is forecasted to increase by an additional year by the end of this decade.4
Pension plan participation is also an indicator. Because membership in a pension plan is typically associated with a higher socioeconomic status, greater rates of mortality improvement have been observed for pension plan participants when compared to the general population. A recent study found that the annual rate of mortality improvement from 2014 to 2017 for pensioners was more than double that of the U.S. population.5
Experience is still needed to ascertain just how these ongoing mortality trends will interact with the pandemic. If precedent holds, those in higher socioeconomic groups or participating in pension plans may be insulated from some of the worst mortality outcomes. It will be important to choose the most suitable mortality basis available for a plan’s population when considering mortality assumptions for pension and other postretirement benefit plans.
New tools
Most plans are not large enough to develop credible mortality assumptions based on their own experience and must rely on published tables. These tables currently only distinguish between white-collar, blue-collar, and high/low payment quartile data sets. Future published tables may need to allow for greater socioeconomic granularity if current trends continue.
In light of this, mortality improvement scales are in development that will allow reflection of finer demographic distinctions. The Society of Actuaries (SOA) has recently published its Mortality Improvement Model (MIM-2021).5 The overarching goal of this model is to provide a consistent framework for developing mortality improvement assumptions, and MIM-2021 is the next generation of mortality improvement modeling.
The SOA recognized that prior versions of its mortality improvement scale, up to and including the recently released MP-2021, were appropriate for retirement-related applications but might not be suitable for applications in other disciplines. In response, MIM-2021 was developed to use the existing methodology with customizable parameters. While it replicates the previous approach, this new model provides more flexibility by allowing for choice in historical data sets, selection of intermediate-term improvement values instead of just select and ultimate, and flexibility in choosing the “jumping off point” from historical data to projected changes. In addition, the revised model allows users to adjust future mortality changes based on their expectations of the impact of COVID-19. Excel-based tools for the construction of mortality improvement rates and data analysis are included. However, utilizing these features will require significant expertise and most users will likely follow generally adopted methods.
The following sections explore how these mortality trends and available tools may affect the assumptions selected by defined benefit plan practitioners and the evaluation of liabilities for different purposes.
Implications for accounting valuations
The valuation of liabilities for defined benefit plans in accordance with Financial Accounting Standards Board (FASB) codification requires the use of assumptions that represent the plan sponsor’s best estimate of future events. Sponsors, in consultation with practitioners (including actuaries and auditors), select assumptions that are appropriate for their plans and covered populations. These assumptions, which include mortality, are used in determining the plan’s benefit expense and funded status, which are disclosed in a sponsor’s financial statements.
Selection of base mortality tables
Although mortality assumptions are not prescribed for accounting valuations, many sponsors select the latest mortality assumptions published by the SOA. For corporate defined benefit plans, such assumptions consist of base mortality rates as described in the Pri-2012 Private Retirement Plans Mortality Tables Report6 with mortality improvement scales updated annually by the SOA. The Pri-2012 Mortality Table set includes several options for sponsors to choose from. They include white-collar, blue-collar, and high/low payment quartile data sets of healthy retirees, disabled retirees, and contingent survivors.
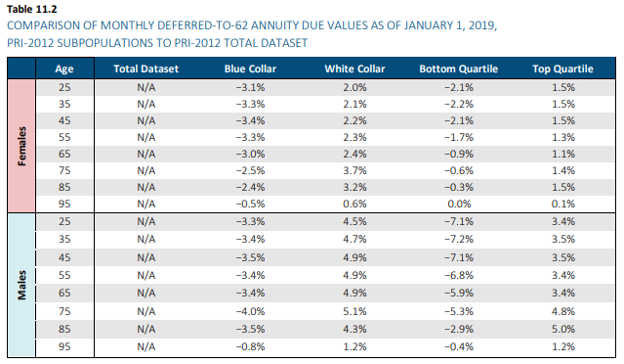
In the report, the SOA suggests that plans with at least 70% of participants classified as either hourly or union should consider using the “Blue-Collar” tables as they may more accurately reflect anticipated experience of the covered population. Similarly, plans with at least 70% of participants classified as both salaried and nonunion should consider using the “White-Collar” tables.7 If specific classifications are known at the participant-level, mixing and matching or even blending rates may be appropriate. The table in Figure 1 is from the SOA’s report highlights the expected differences produced by each option.
Figure 1: Expected Differences of Classifications (per SOA report)
Source: Pri-2012 Private Retirement Plans Mortality Tables Report.
As evidenced above, each option is expected to produce materially different results from those expected using the total data set. Given the widening gaps in life expectancies among socioeconomic groups, which may be exacerbated by recent COVID-19 pandemic experience8, 9, 10 it is important for sponsors to consider their plan populations and select the base mortality rates most appropriate to them.
Mortality improvement scale and adjustments
Improvements in mortality are expected over time and, as previously stated, the SOA publishes updated mortality improvement scales annually. Scale MP-2021 was recently released and reflects mortality experience in the United States through 2019. Use of this scale is expected to increase plan liabilities by about 0.2% to 0.4% compared to the previous scale, MP-2020.11 This represents the first year-over-year increase since the MP series was initially published in 2014. Many plan sponsors will likely reflect this latest mortality improvement scale in some form while preparing their upcoming fiscal yearend disclosures. However, it is important to note that MP-2021 was constructed using pre-pandemic experience and does not reflect the short-term or any anticipated long-term impacts of COVID-19. Due to the ongoing effects of the pandemic and significant uncertainty, any such adjustments are left to individual practitioners.
Experience of increased deaths over expectations since the onset of the pandemic in March 2020 has continued into 2021.12 Practitioners will likely be faced with the issue of reconciling the evidence of excess mortality over the past 18 months with a mortality improvement scale suggesting that long-term mortality has decreased since the prior year. It would be natural to expect that next year’s improvement scale, which will incorporate experience acquired during the pandemic, will predict a significant drop in mortality improvement.
One approach to reconciling these conflicting notions is reflected in the most recent annual report by the Social Security Administration (SSA). The SSA incorporates the expected impact of COVID-19 by loading mortality expectations for 2020 through 2023 and assumes that mortality experience will subsequently revert to prior expected levels. Loads of 16.4% for 2020, 15% for 2021, 4% for 2022, and 1% for 2023 are reflected. Due to significant uncertainty about the long-term effects of COVID-19, the SSA’s report presumes “that increased deaths from the residual effects of living through the pandemic (both physiological and psychological) will be roughly offset by decreased deaths that instead happened sooner (during the pandemic).”13
For practitioners wishing to make similar adjustments, the SOA’s enhanced MIM-2021 tool allows users to adjust mortality rates through annual loads like those reflected in the SSA report. Loads may be applied, based on age and sex, for each year from 2020 through 2024 and for years after 2024 should lasting effects of COVID-19 be assumed. Many practitioners may follow generally adopted methods if adjustments to MP-2021 are warranted, but care should be taken to account for differences among various industries and populations and to consider experience and other relevant factors. For example, if plan-specific mortality experience over the previous two years is being considered, practitioners may also consider other demographic experience such as terminations and retirements during this period. Plan sponsors and practitioners may face more scrutiny this year given the data and tools now available and will likely need to justify selected assumptions more fully whether or not adjustments are made to reflect the pandemic.
Other postretirement benefit plans
There are similar considerations for other postretirement benefit plans. An argument could be made that it is even more important to select the best representative mortality assumptions for these types of plans, given the amplification of long-term liabilities that occurs from the application of medical trends. Differences among various options published in the Pri-2012 Private Retirement Plans Mortality Tables Report are likely to be greater for postretirement medical plans than illustrated in Figure 1 above. Also, it should be noted that changes in mortality assumptions have the opposite effect on postretirement life insurance liabilities (i.e., excess deaths or decreases in mortality improvement generally result in greater postretirement life insurance liabilities, because payouts are expected sooner, as opposed to postretirement medical or defined benefit pension plans where payouts would be expected to end sooner).
There are many factors that must be considered when selecting best estimate assumptions. The type of plan, the plan sponsor’s industry, the covered population, demographic trends, and recent pandemic experience all play a role in the mortality assumption selection process and will materially impact liability projections.
Implications for funding valuations
Mortality assumptions are generally mandated by the Internal Revenue Service (IRS) when evaluating single-employer pension plan liabilities for purposes of minimum contribution requirements, benefit restrictions, the determination of minimum lump sum payments to plan participants, and government filings such as for Pension Benefit Guaranty Corporation (PBGC) premiums. To understand how recent trends in mortality may impact the evaluation of pension plans for these purposes, it is important to understand the applicable regulatory framework.
Prescribed assumptions
The IRS prescribes, with limited flexibility, specific rates of mortality and mortality improvement (by age, gender, and cohort), as well as the way in which these rates are applied. Base mortality rates and mortality improvement assumptions are promulgated through annual IRS notices. With limited exceptions, separate base mortality rates must be applied to participants not yet in payment status, or “non-annuitants” (e.g., active employees, terminated vested participants), and those in receipt of their pension benefits, or “annuitants” (e.g., retirees, surviving beneficiaries). Mortality rates for annuitants are typically greater than for non-annuitants of the same age to account for a lower probability of death for individuals able to work. As a result, a pension plan will typically use six sets of assumptions: separate base rates for male and female annuitants, separate base rates for male and female non-annuitants, and separate improvement rates for males and females.
One exception is that plans large enough to have credible experience (as defined by the IRS) are permitted (with approval from the Commissioner) to use mortality assumptions specifically related to the experience of the plan rather than those mandated by the IRS.15 However, this exception is rarely used in practice because of the approval process and the fact that most pension plans do not meet the credibility thresholds.
Lump sum distributions
Mortality assumptions used in determining lump sum distributions to plan participants are also prescribed by the IRS in a similar manner as for funding liabilities. This “applicable mortality” table is constructed as a 50/50 blend of the male and female mortality assumptions applicable to small plan sponsors and there is no option to use plan-specific rates. To the extent a plan offers lump sums, the applicable mortality assumption must be reflected in evaluating funding liabilities.
This assumption also directly impacts the value of the pension benefits that plan participants receive. Although lump sum values tend to be more sensitive to swings in interest rates, all else equal, a more pessimistic outlook on mortality (i.e., a long-term reduction in longevity) will result in smaller lump sum payouts. The table in Figure 2 illustrates the isolated impact prescribed mortality assumptions have had on lump sum distributions in recent years.
Figure 2: Prescribed Mortality Assumptions and Lump Sum Distributions
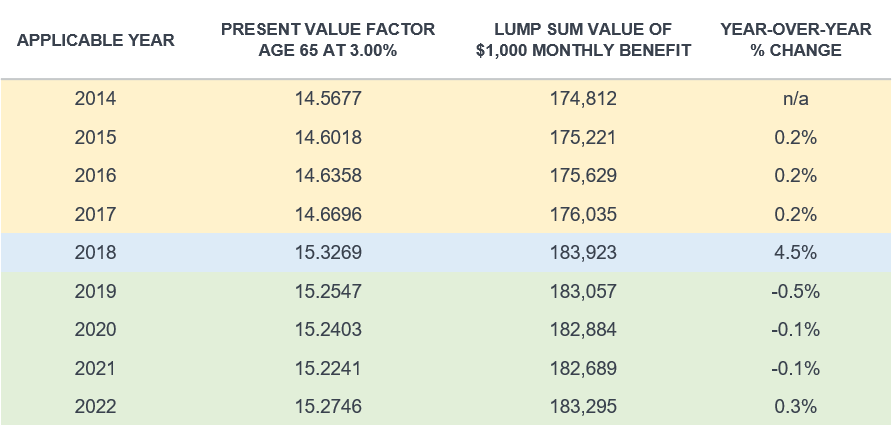
There are a few observations that can be gleaned from the above illustration. The uniform increase in lump sum values prior to 2018 occurred because the IRS had been using the same base mortality and improvement assumptions each year, only updating the period of statically projected improvement annually. The large spike in value from 2017 to 2018 was due to an update in underlying assumptions. The IRS moved from using assumptions based on experience from decades ago (through the early 1990s) to more recent experience. After 2018, there are uneven changes in values because the IRS now reflects updated mortality improvement assumptions each year. The annual changes correspond to the year-over-year changes in published improvement scales.
What may lie ahead
How may recent mortality trends impact funding valuation results, given the current regulatory framework? Most recently, the IRS prescribed use of RP-2014 base rates with improvements projected in accordance with MP-2020 from the 2006 base year for valuation dates occurring in 2022.16 The mandated base rates have been in effect since 2018, with annual updates only reflecting more recently published mortality improvement scales from the SOA. There is a significant lag in recognition of mortality experience inherent in the current structure of prescribed updates. Valuations prepared during 2022 will be required to use base mortality rates developed with a central year that is 16 years prior and to reflect mortality improvement using experience through 2018. Under this structure, any impact of the COVID-19 pandemic will not be reflected in funding valuations until 2024 at the earliest. Furthermore, prescribed mortality assumptions must be revised at least every 10 years “to reflect the actual experience of pension plans and projected trends in such experience.”17 Therefore, it is possible that any update in base mortality rates reflecting recent mortality trends will not be effective until 2028. By that time, lasting effects of the pandemic are likely to be better understood and measurable. Thus, if it is determined that there is no long-term impact to mortality, then funding valuation results may never reflect experience during the pandemic.
Beyond the pandemic, prescribed assumptions reflect general mortality experience of pension plan participants across all industries and do not currently allow for the selection of adjustments ("collar" or otherwise) that may more accurately predict experience for plan participants in certain trades. To the extent experience differs among socioeconomic groups, funding liabilities among pension plans are normalized. For example, a widening in the gap of life expectancy between white-collar and blue-collar workers may result in overvaluing pension liabilities for blue-collar industries while undervaluing liabilities for white-collar employees. Funding liabilities will reflect emerging pandemic experience only for plans of sufficient size that produce credible mortality data, under the current regulatory framework.
As with the evaluation of funding liabilities, prescribed lump sum assumptions are constructed with significant lag. Therefore, any impact of the COVID-19 pandemic may never directly influence lump sum distribution amounts. However, the pandemic may instead directly influence participant behavior. Due to significant uncertainty surrounding life expectancies, a plan participant may be more willing to receive the full pension benefit now in a lump sum distribution rather than take a “gamble” and receive the benefits through an annuity. Plan sponsors and practitioners should pay close attention to recent decisions made by plan participants and determine whether they are indicative of lasting trends. Such behavior may also inform plan sponsors who are thinking about offering lump sum windows to participants not currently afforded the option of taking a full cash distribution.
Unlike accounting valuations, the mortality assumption used in evaluating pension plan liabilities for purposes of minimum contribution requirements, benefit restrictions, and PBGC premiums as well as the determination of minimum lump sum payments to plan participants is largely out of the hands of plan sponsors and practitioners. These assumptions are prescribed by the IRS with limited flexibility. Consequently, unless there is a change to the current release structure, any recent trends or experience from the pandemic are not likely to flow through these results for some time, if at all.
Implications for annuity purchases
Between stringent industry standards for reserves18,19 and emergent experience of far lower excess mortality than originally predicted,20 the impact of pandemic-related mortality on life insurers has been muted. Of more concern has been the economic effects coming from pandemic restrictions and the associated market uncertainties. Annuity purchases continue to proceed at a rapid pace as plan sponsors seek to de-risk.
Industry resilience and less-than-expected pandemic severity
In 2020, insurance ratings firm AM Best quickly responded to news of the pandemic with a stress test questionnaire for insurers.21 This study aimed to obtain baseline results about the expected effect of the pandemic on insurers’ underwriting and assets, as well as to identify areas for further study. Insurers were asked if any changes had been made to operations and about the preliminary impact of the pandemic on their financial positions. They were also queried about their changes to stress testing procedures and whether emerging and anticipated impact exceeded risk parameters. Finally, insurers were asked to provide any adjustments made to their 2020 financial projections and the assumptions used therein.
Initial results indicated that insurers would remain well protected, with the Best’s Capital Adequacy Ratio (a benchmark of the insurance company’s balance sheet strength) remaining the same for 75% on average of the insurers studied. Key threats for ongoing monitoring included increased mortality and claims, downturns in financial markets and liquidity, business continuity, regulatory changes, and additional risk exposures. Note that even though increased mortality could result in lower annuity payouts for an annuity provider, any savings could be more than offset by increased life insurance claims, affecting the financial strength of the company.
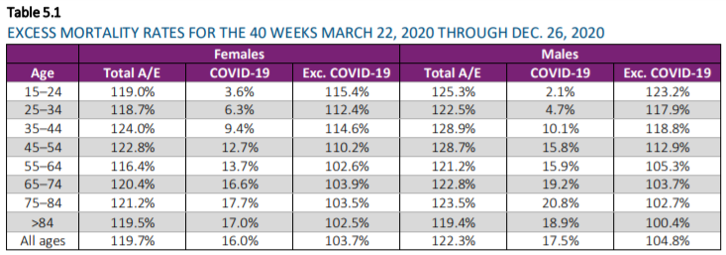
Not only has the severity of pandemic excess mortality been less than predicted, but the distribution of excess deaths has been favorable for life insurers. Figure 3 illustrates the age distribution of excess mortality during 2020. COVID-19 deaths among ages below 65 are moderated compared to those for ages over 65, meaning that an expensive increase in early life insurance payouts among younger policyholders has not materialized. Concurrently, the increase in deaths among older ages has resulted in lower annuity payouts.
Figure 3: Age Distribution of Excess Mortality, 2020
Source: SOA, “Developing a Consistent Framework for Mortality Improvement: MIM-2021-v2.” See https://www.soa.org/globalassets/assets/files/resources/research-report/2021/2021-mim-consistent-framework-v2.pdf.
Economic considerations for annuity providers
Of more immediate concern to annuity providers is the state of financial markets. High volatility, a low interest rate environment, and uncertainty about the ongoing effects of the pandemic have combined to create uncertainty about investment returns, liquidity, and earnings.
Financial markets declined at the inception of the pandemic, but despite the possibility of a long-term downturn in response to the pandemic, returns have been strong overall in the 18 months following the beginning of the pandemic, as illustrated in Figure 4, which shows S&P 500 Index performance. Because life insurers rely on investment income to generate income from premiums paid, this trend has reassured annuity providers that were initially concerned about a market collapse. However, with events rapidly occurring in the economic, social, and regulatory spheres, it is not clear what trends will influence investment returns most decisively in the coming years.
Figure 4: S&P 500 Index, January 2020-September 2021

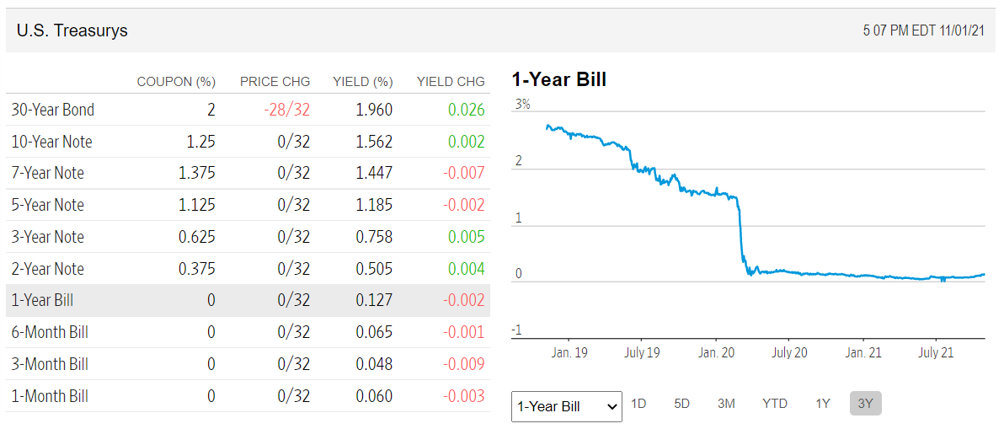
Interest rate risk is another key concern for life insurers, and the persistent low interest rate environment has eroded profits and increased reserve requirements. Short-term interest rates have hovered near zero since the beginning of the pandemic, with longer-term rates at historic lows. As the pandemic is ongoing, it is not clear if or when interest rates will increase.
Figure 5: U.S. Treasuries, January 2019-July 2021
Source: Wall Street Journal. See https://www.wsj.com/market-data/bonds.
Recent risk transfer trends
Plan sponsors have responded to the pandemic with a flurry of de-risking. A host of challenges such as the complexity of managing pension plans, concerns about returns given market volatility and low interest rates, PBGC premiums, increasing demographic maturity, and an uncertain regulatory environment have combined to cause many sponsors to offload their pension obligations.
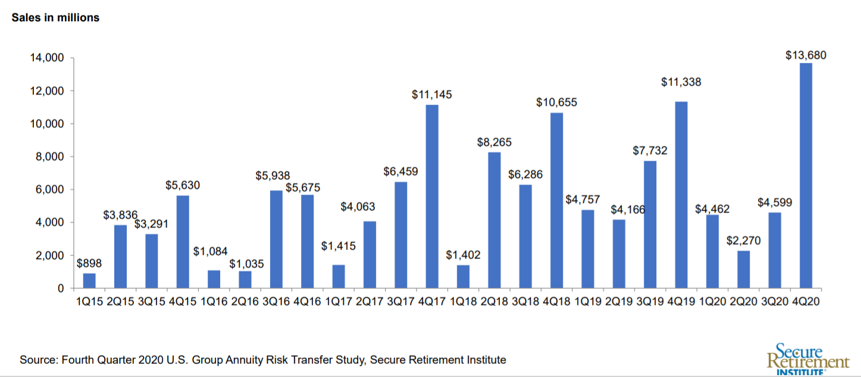
Annuity purchase data over the past two years shows that after a pause in the second quarter of 2020, de-risking has continued to take place with a volume of over $25 billion in 2020.
According to a MetLife 2021 survey,22 the pandemic and current economic conditions continue to encourage sponsors to transfer liabilities to insurers, with 42% of respondents indicating that COVID-19 has increased or accelerated the likelihood that they would purchase annuities. A majority of the $3.4 trillion in plan assets held by private sector defined benefit plans is expected to be de-risked within 10 years, based on this survey.
On the insurer side, we have not found any indications that annuity purchase prices have changed as a result of pandemic mortality increases. Milliman annuity placement specialists report that annuity pricing for retirees remains close to projected benefit obligation (PBO) levels, suggesting that either there have not been mortality adjustments or they have been offset by other considerations. This may change if the pandemic continues and excess deaths increase further, although the ultimate effect on pricing is dependent on multiple factors.
Conclusions and next steps
Though one near-term effect of the pandemic was a significant increase in mortality, a consensus has not yet developed among leading institutions as to the long-term impact on mortality trends. While there are tools available for practitioners to model future mortality changes based on their professional judgment, it may be years before the true impact of the pandemic is known. Given historical trends, it is possible that pension plan participants will not experience a significant decrease in mortality improvement. At present, it is recommended that plan sponsors continue to select the base mortality rates most appropriate to their plan populations.
The current regulatory environment and limitations in published rates have imposed some restrictions on practitioners. Mortality rates and levels of improvement with greater socioeconomic granularity may be needed to reflect emerging trends more accurately. In addition, more flexibility in using prescribed assumptions may be warranted. For now, the impact of the pandemic may be most clearly seen, not in changes to plan participants’ mortality, nor in annuity prices, but rather in participants’ choices regarding their benefits, such as the election of lump sums over annuities.
At Milliman, we are carefully monitoring emerging trends, providing input to institutions, and guiding clients through these uncertain times. When questions arise, contact your Milliman representative to discuss options and gain clarity.
1SOA (May 2021). 2020 Excess Deaths in the U.S. General Population by Age and Sex. Retrieved November 19, 2021, from https://www.soa.org/globalassets/assets/files/resources/research-report/2021/05-excess-deaths-gen-population-update.pdf.
2Aburto, J.M. et al. (September 26, 2021). Quantifying impacts of the COVID-19 pandemic through life-expectancy losses: A population-level study of 29 countries. International Journal of Epidemiology. Retrieved November 19, 2021, from https://academic.oup.com/ije/advance-article/doi/10.1093/ije/dyab207/6375510.
3Barbieri, M. Mortality by Socioeconomic Category in the United States. SOA. Retrieved November 19, 2021, from https://www.soa.org/resources/research-reports/2020/us-mort-rate-socioeconomic/.
4Club Vita Research Note 21-08: Longevity improvement rates for U.S. defined benefit pension plan participants.
5SOA Longevity Advisory Group. The Mortality Improvement Model, MIM-2021-v2. Retrieved November 19, 2021, from https://www.soa.org/resources/research-reports/2021/mortality-improvement-model/.
6SOA (October 2019). Pri-2012 Private Retirement Plans Mortality Tables Report. Retrieved November 19, 2021, from https://www.soa.org/globalassets/assets/files/resources/experience-studies/2019/pri-2012-mortality-tables-report.pdf.
8SOA (December 2020). Mortality by Socioeconomic Category in the United States. Retrieved November 19, 2021, from https://www.soa.org/globalassets/assets/files/resources/research-report/2020/mort-socioeconomic-cat-report.pdf.
9Mendoza, D.L. et al. (August 4, 2021). The Role of Structural Inequality on COVID-19 Incidence Rates at the Neighborhood Scale in Urban Areas. MDPI. Retrieved November 19, 2021, from https://www.mdpi.com/2673-8112/1/1/16/pdf (PDF download).
10Klamann, S. & Wyloge, E. (November 2, 2021). Colorado’s blue-collar workers of color bore highest COVID-19 death rates, data shows. Denver Gazette. Retrieved November 19, 2021, from https://denvergazette.com/premium/blue-collar-workers-of-color-bore-highest-covid-19-death-rates-data-shows/article_d5d94c7e-38fa-11ec-a720-23642c392dfb.html (subscription required).
11SOA Research Institute (October 2021). Mortality Improvement Scale MP-2021. Retrieved November 19, 2021, from https://www.soa.org/globalassets/assets/files/resources/experience-studies/2021/2021-mp-scale-report.pdf.
12SOA, 2020 Excess Deaths in the U.S. General Population by Age and Sex, op cit.
13The 2021 Annual Report of the Board of Trustees of the Federal Old-Age and Survivors Insurance and Federal Disability Insurance Trust Funds is available at https://www.ssa.gov/OACT/tr/2021/tr2021.pdf.
18National Association of Insurance Commissioners (April 2010). Actuarial Opinion and Memorandum Regulation. Retrieved November 19, 2021, from https://content.naic.org/sites/default/files/inline-files/MDL-822.pdf.
19Actuarial Standards Board (December 31, 2012). Actuarial Standard of Practice No. 22. Retrieved November 19, 2021, from https://www.actuarialstandardsboard.org/wp-content/uploads/2014/02/asop022_167.pdf.
20Biggs, A.T. & Littlejohn, L.F. (March 2021). Revisiting the initial COVID-19 pandemic projections. The Lancet. Retrieved November 29, 2021, from https://www.thelancet.com/journals/lanmic/article/PIIS2666-5247(21)00029-X/fulltext
21AM Best. COVID-19 Stress Testing Results and Next Steps. Retrieved November 19, 2021, from https://www.ambest.com/video/Video.aspx?rc=297276 (registration required).
22MetLife. 2021 Pension Risk Transfer Poll. Retrieved November 19, 2021, from https://www.metlife.com/content/dam/metlifecom/us/homepage/ris/MetLife-2021-Pension_Risk_Transfer_Poll_Final_10-5-21.pdf.
